Claude Code agents fail because we treat them like synchronous
The biggest mistake I see people make with LLM agents is trying to debug them like a standard JavaScript function. You can't just throw a console.log in there or set a breakpoint and expect to find the bug. Agent execution is non-deterministic; you can run the exact same prompt twice and get two different tool-call sequences. By the time an agent crashes or gives a hallucinated answer, the actual "decision" that caused the failure happened five turns ago in a hidden reasoning chain.
If you want to actually fix your AI workflow, you have to stop looking at the output and start obsessing over the execution transcripts.
Why your agent is actually breaking
After spending a lot of time with Claude Code, I've noticed that almost every "random" failure falls into one of these three buckets:

- Silent Context Overflow: The agent hits the token limit, but instead of crashing, it just "forgets" the critical instruction from the start of the session.
- Schema Hallucinations: The model invents a field name that doesn't exist in your tool's JSON schema, leading to a tool error that the agent then tries (and fails) to "fix" by guessing again.
- Reasoning Loops: The agent gets stuck in a cycle where it calls Tool A, gets an error, decides to try Tool A again with a slight variation, and repeats this until the budget runs out.

How to trace tool calls effectively
To get a real handle on this, you need a deep dive into the transcripts. A proper trace isn't just a log of what happened; it's a record of the assistant's reasoning before the tool call.
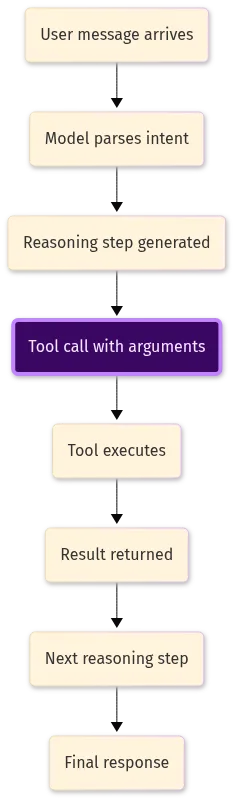
When I'm debugging, I look for the gap between the "Thought" and the "Action." If the thought says "I need to check the user's email" but the tool call is getUserData({ id: 'null' }), you don't have a tool bug—you have a prompt engineering problem where the model isn't extracting the ID correctly.
Tooling for observability
Depending on where you are in the dev cycle, different tools hit differently:

- LangSmith: Best for deep trace inspection when you're trying to figure out exactly why a specific production request went sideways.
- Arize Phoenix: Great for local iteration because it doesn't require as much cloud overhead.
- Braintrust: This is the way to go if you're doing eval-driven debugging (comparing version A of a prompt vs version B).
Pro tip for meta-analysis
If you have a mountain of logs, don't read them manually. Feed the structured traces back into a separate LLM instance. Use a prompt that forces the model to separate the symptom (e.g., "The agent failed to update the database") from the root cause (e.g., "The agent misinterpreted the date format in the tool output"). This turns a week of manual log digging into a ten-minute summary.
All Replies (3)
Want a live back-and-forth? Join the global AI chat room — login to talk.
Skeptical. My logs are just full of hallucinations. How do you actually verify the output?
Curious if a strict state machine stops the drift. Has anyone implemented that yet?
Frustrating! I wasted three hours on a loop yesterday. Anyone else struggle with the timing?