Building a PSX Research Workflow for Market Analysis in 2026
Building a Research Workflow from Scratch
For anyone starting out, the biggest mistake is relying on a single news source. You need a diversified AI workflow to filter the noise. I recommend setting up a system where you track three specific data streams: the KSE-100 index movement, the USD/PKR exchange rate, and the official policy rate announcements from the State Bank. When these three diverge, that's usually where the most significant trading opportunities (or risks) hide.
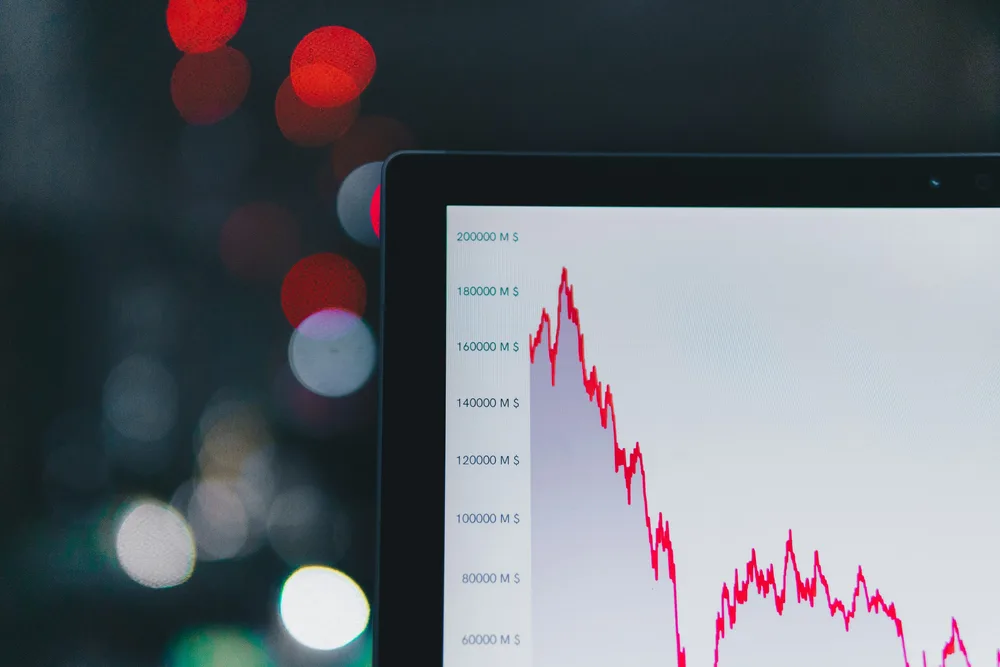
If you are looking for a practical tutorial on how to screen stocks, stop looking at "top gainers" lists. Instead, focus on the Price-to-Earnings (P/E) ratio relative to the sector average. In the PSX, certain sectors like commercial banks or fertilizer companies often trade at premiums, but if a stock's P/E spikes without a corresponding increase in dividend yield, it's often a speculative bubble rather than organic growth.
Managing Risk in a High-Volatility Environment
Risk management in this market isn't just about diversifying your portfolio; it's about liquidity. A common trap for beginners is buying into "penny stocks" that look cheap but have zero trading volume. You might see a theoretical profit on your screen, but you can't actually sell the position without crashing the price.
To avoid this, implement a strict liquidity filter. Only enter positions where the average daily trading volume exceeds a specific threshold based on your position size. This ensures you can exit the trade without slippage.
Using LLM Agents for Market Sentiment
Since manual research is tedious, using an LLM agent for sentiment analysis can be a huge advantage. You can feed the agent the latest quarterly reports and news headlines to gauge whether the market sentiment is genuinely bullish or just reacting to a temporary rumor. Here is a basic prompt structure you can use to analyze company filings:
Analyze the following financial report for [Company Name].
1. Extract the net profit growth percentage compared to the previous year.
2. Identify any mentioned risks regarding currency devaluation or raw material costs.
3. Compare the current dividend payout ratio with the 3-year average.
4. Provide a sentiment score from -1 (Bearish) to 1 (Bullish) based on the management's outlook.
By automating the data extraction phase, you spend less time reading PDFs and more time making actual deployment decisions for your capital. The goal is to move from emotional trading to a data-driven approach where every entry has a predefined exit point based on technical support levels or fundamental catalysts.
All Replies (4)
Want a live back-and-forth? Join the global AI chat room — login to talk.
My basic spreadsheet for sentiment tracking is a lifesaver. How do you organize your news columns?
I'm curious which indicators you're pairing with the news feed for the 2026 outlook.
Manual tracking was a disaster for me last year. Which routine actually works for this?
Switching to a scraping script changed everything for my workflow. Which library did you use?