Inspector for AI agents finally makes debugging less of a black box
Debugging AI agents is a nightmare because everything happens in a stream—tool calls, subagent delegation, and long-running processes all blur together. The new Inspector tool from CopilotKit tries to solve this by surfacing every event between the agent and the frontend in real-time. It essentially links failures directly to the event that caused them and includes a Playground where you can fork saved conversations to test different paths without polluting your actual app's chat history.
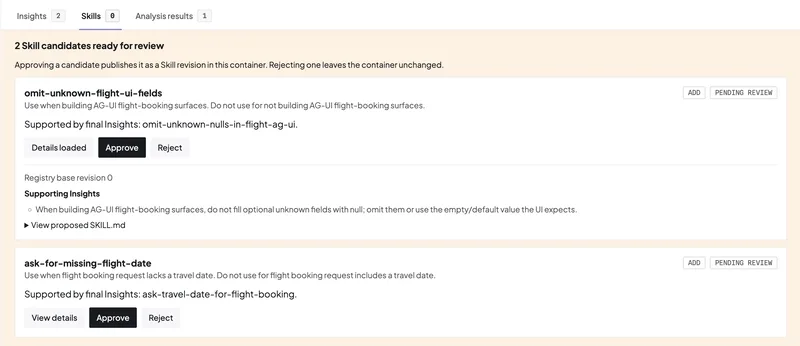
The whole system relies on the AG-UI (Agent-User Interaction Protocol) to connect agents to the UI. The most interesting part is the connection to CopilotKit Intelligence, which claims to enable "self-learning." It analyzes patterns across saved threads and generates SKILL.md files. You have to review and edit these before they ship, but it's an attempt to turn user interactions into permanent agent skills.
How to get it running
You don't actually install the Inspector separately; it's baked into the CopilotKit provider and active by default in development builds. It supports React, Vue, and Angular.
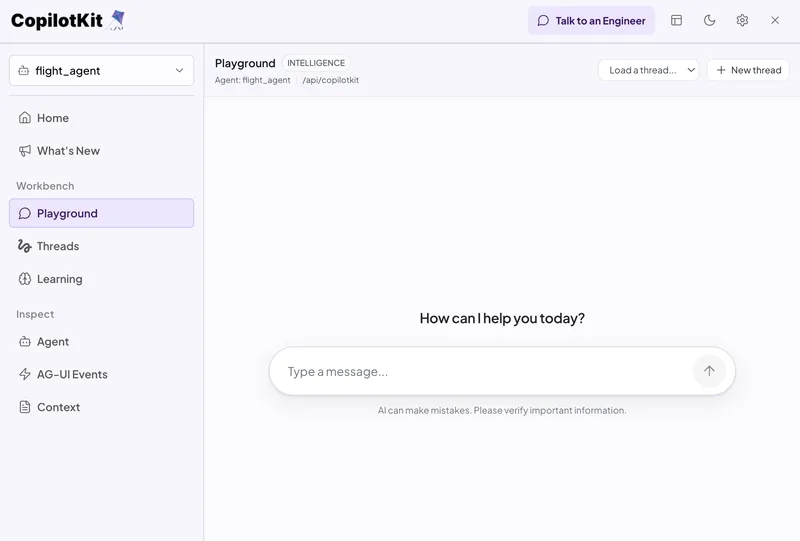
To start a fresh project, use:
npx copilotkit@latest createIf you're using the React core, it looks like this:
import { CopilotKit } from "@copilotkit/react-core/v2";If the Inspector is getting in your way, you can kill it using the enableInspector prop. This works the same across all three supported frameworks:
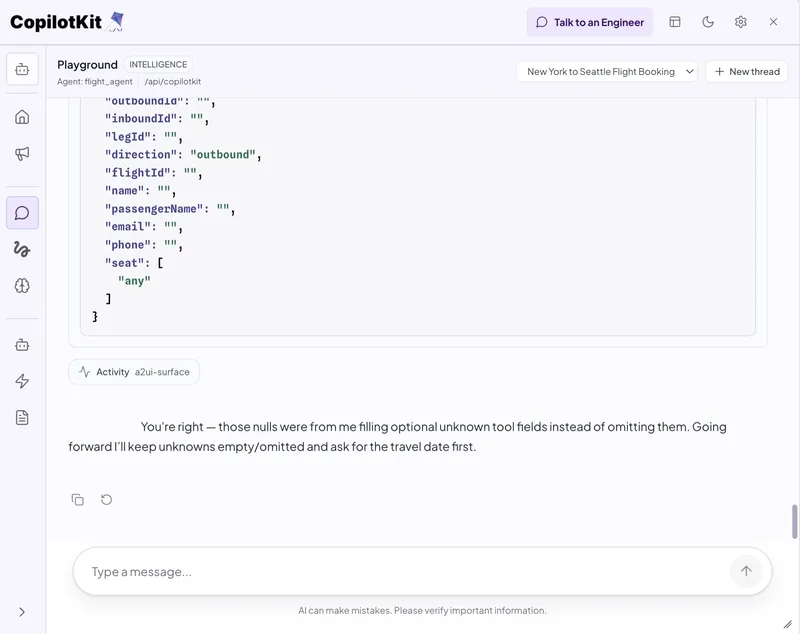
provideCopilotKit({ runtimeUrl: "/api/copilotkit", enableInspector: false })One detail to note: the Inspector is hard-coded to stay out of production and server rendering, so even if you set the flag to true, it won't leak into your live environment.
The "Automatic Learning" loop
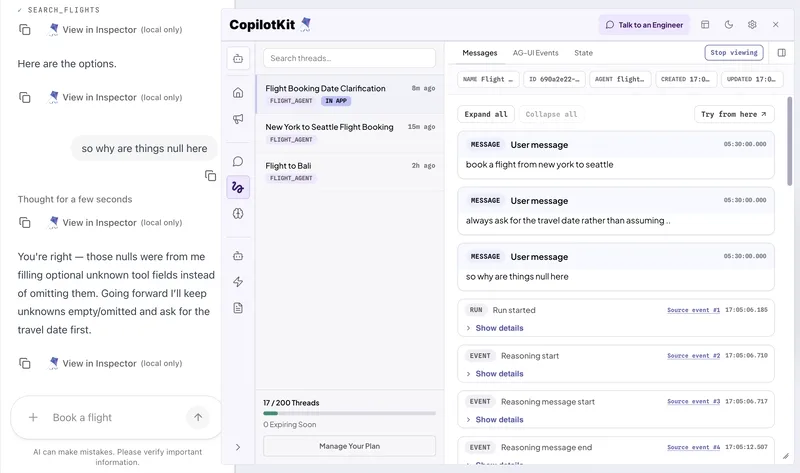
The workflow here is Threads → Insights → Skills → Agent. The system scans the runs behind your saved threads, identifies recurring patterns, and writes them into a SKILL.md file.
These are stored in Learning containers, which let you control whether the learned skill applies to a single user, a specific team, or the entire organization. For instance, if users constantly have to correct an agent on how to schedule meetings (e.g., "check calendars but don't book without asking"), the system identifies that pattern and creates meeting-scheduling/SKILL.md. Once you approve it, the agent applies that logic to future runs.
Using the Playground for edge cases
The Playground is basically an isolated tab that hits your actual app runtime. It's a decent way to test weird edge cases or throw junk at the agent without ruining your actual conversation logs.
The key feature here is the ability to fork a stored conversation into the Playground. You can pick up exactly where a previous session stopped and try a different prompt direction to see if you can fix a failure. Just keep in mind that Playground threads are volatile and disappear when your local session ends, unless you have CopilotKit Intelligence connected to persist them.
All Replies (4)
I want to try this tonight. Does this actually work with LangGraph or is it just for custom setups?
I'm skeptical this actually works. Does this tool handle the 404 errors I get with most auto-apply scripts?