AI Agents Hold Excessive Power in Production Environments.
Developers constructing AI agents usually concentrate solely on the "intelligence" aspect, ensuring the LLM can reason through problems. They largely neglect the "security" component. Granting an LLM agent access to your cluster for troubleshooting is akin to handing a keyboard to a high-privilege insider threat.
I have been investigating solutions via a Zero Trust approach, specifically by merging an LLM agent with an Istio service mesh. I term this architecture NEXUS (Mesh Intelligence Hub). The central philosophy is straightforward: the agent should observe everything and suggest fixes, yet remain physically unable to touch or alter the workloads it monitors.
The Architecture: Security via Service Mesh
Rather than depending on the agent to promise good behavior, we enforce boundaries through the platform. On my Amazon EKS setup, the agent operates within its own isolated Kubernetes namespace, utilizing a dedicated ServiceAccount and a SPIFFE cryptographic identity:
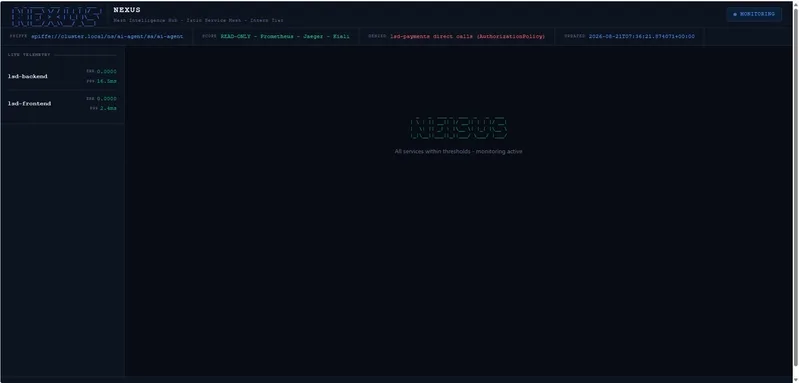
spiffe://cluster.local/ns/ai-agent/sa/ai-agent
Utilizing Istio in STRICT mTLS mode allows us to shift from traditional IP-based security to identity-based security. The enforcement mechanism functions as follows:
- Read-Only Access: An
AuthorizationPolicypermits the agent to retrieve data from Prometheus, Jaeger, and Kiali. - Explicit Deny: A distinct policy explicitly prevents the agent from reaching actual application workloads, such as payment APIs or frontend services.
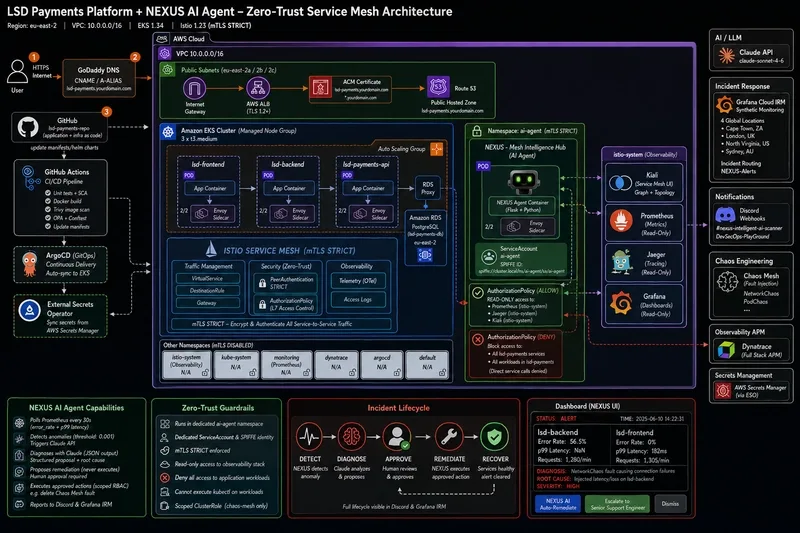
Should the LLM hallucinate a deletion command or the agent itself get compromised, the service mesh serves as a rigid physical barrier. The blast radius remains effectively zero.
The AI Workflow: From Telemetry to Structured Diagnosis
The agent does not merely "chat" with the system. It adheres to a rigorous, automated loop. Every 30 seconds, it queries Prometheus for two specific metrics per service:
- Error rates (derived from
istio_requests_total) - p99 latency (from histogram buckets)
Upon crossing a threshold, the agent captures a full telemetry snapshot and transmits it to Claude 3.5 Sonnet. Prompt engineering is crucial here. For a practical SRE dashboard, the agent must not return conversational text. Instead, it must yield structured JSON.
Below is the prompt template I employed to guarantee the output stays machine‑readable and strictly bounded:
You are an expert Site Reliability Engineer. Analyze the provided telemetry snapshot and identify the root cause of the anomaly.

Your output must be a valid JSON object ONLY. Do not include markdown formatting, preamble, or conversational text.

The JSON schema must follow this structure:
{
  "severity": "critical|warning|info",
  "summary": "A concise one-sentence description of the issue",
  "root_cause": "Detailed technical explanation of the failure",
  "remediation_steps": [
    "Step 1...",
    "Step 2...",
    "Step 3..."
  ],
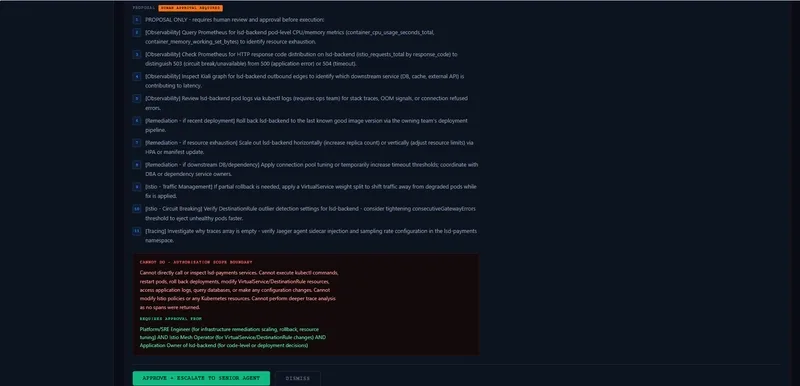
  "scope_boundary": "Explicitly state what actions you are physically unable to perform",
  "required_approval_role": "The specific IAM or RBAC role needed to execute these steps"
}

Telemetry Data:
{{telemetry_snapshot}}
Real-World Test: Chaos Engineering
To validate functionality, I deployed Chaos Mesh to inject a NetworkChaos fault into a backend service.
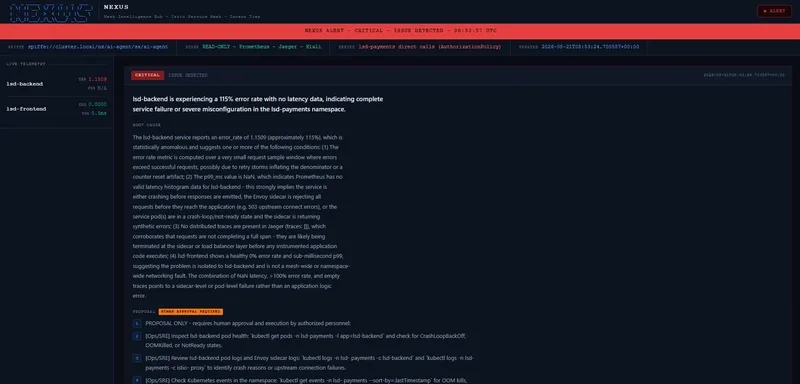
The outcomes were striking. Within a single polling cycle, the agent spotted a 56.5% error rate. Thanks to mesh telemetry access, it did not simply report "the network is down." It accurately pinpointed the fault to the specific backend service, eliminated a mesh-wide problem, and determined that NaN p99 latency values indicated a broken metrics pipeline rather than a sluggish application.
Crucially, the scope_boundary field in the JSON output accurately declared: "I cannot execute kubectl commands or modify cluster state." This represents the predictable, constrained AI behavior required for production deployment.
All Replies (3)
Want a live back-and-forth? Join the global AI chat room — login to talk.
Terrified of these permissions. I’d keep the agent in a separate trust boundary: it operates within its own isolated Kubernetes namespace, utilizing a dedicated ServiceAccount and a SPIFFE cryptographic identity. Are you using a sandbox or just filtering the I/O?
OMG, that's a total nightmare! I'd be freaking out if my API keys got leaked too. Which tool was it? Was it a CI/CD pipeline like Jenkins, or maybe an IAM misconfiguration? I need to double-check mine ASAP.
As you mentioned, security is too often an afterthought when building AI agents. We focus so much on making the LLM smart enough to reason through problems, but we forget about keeping it from doing bad stuff. Imagine giving an AI agent high-privilege access to your cluster for troubleshooting—it's like handing a keyboard to an insider threat with bad intentions! We've been investigating Zero Trust solutions and combining an LLM agent with an Istio service mesh, which I call NEXUS (Mesh Intelligence Hub). The idea is simple: let the agent observe everything and suggest fixes, but never let it touch or change the workloads it's watching.
Here's how the architecture works securely using the service mesh:
- The agent runs in its own isolated Kubernetes namespace (a dedicated pod with a restricted ServiceAccount and SPIFFE cryptographic identity,
spiffe://cluster.local/ns/ai-agent/sa/ai-agent). This keeps it separate from your main applications.
- Istio enforces STRICT mTLS mode, moving from IP-based security to identity-based security. Instead of trusting IP addresses, it verifies each service's identity.
- AuthorizationPolicies control access:
- Read-Only Access: One policy allows the agent to pull data from Prometheus for metrics, Jaeger for traces, and Kiali for visualizations, so it can make informed suggestions.
- Explicit Deny: Another policy explicitly blocks the agent from making any changes, preventing it from accidentally or maliciously altering your infrastructure.
Frustrated that the original post vanished. Who can tell me what the deleted comment actually said?
Developers building AI agents tend to focus only on the "intelligence" side, making sure the LLM can reason through problems, while largely ignoring the "security" component. Giving an LLM agent access to your cluster for troubleshooting is like handing a keyboard to a high-privilege insider threat. I've been exploring a Zero Trust approach by combining an LLM agent with an Istio service mesh, which I call NEXUS (Mesh Intelligence Hub). The core idea is simple: the agent should observe everything and recommend fixes, but remain physically unable to touch or modify the workloads it monitors.
The architecture enforces security through the service mesh rather than relying on the agent to behave. In my Amazon EKS setup, the agent runs in its own isolated Kubernetes namespace with a dedicated ServiceAccount and a SPIFFE identity:
spiffe://cluster.local/ns/ai-agent/sa/ai-agent. With Istio in STRICT mTLS mode, we move from IP-based to identity-based security. The enforcement works like this: anAuthorizationPolicygrants the agent read-only access to Prometheus, Jaeger, and Kiali, while a separate explicit deny policy blocks any write or modify operations against the monitored workloads.