TraceMind AI: AI SRE Workflow with SigNoz
Debugging distributed systems is a nightmare compared to actually writing the code. When a production incident hits, you're usually jumping between logs, traces, and metrics, trying to piece together a timeline while the clock is ticking. TraceMind AI is an interesting take on solving this by turning SigNoz and OpenTelemetry data into an AI-driven SRE assistant.
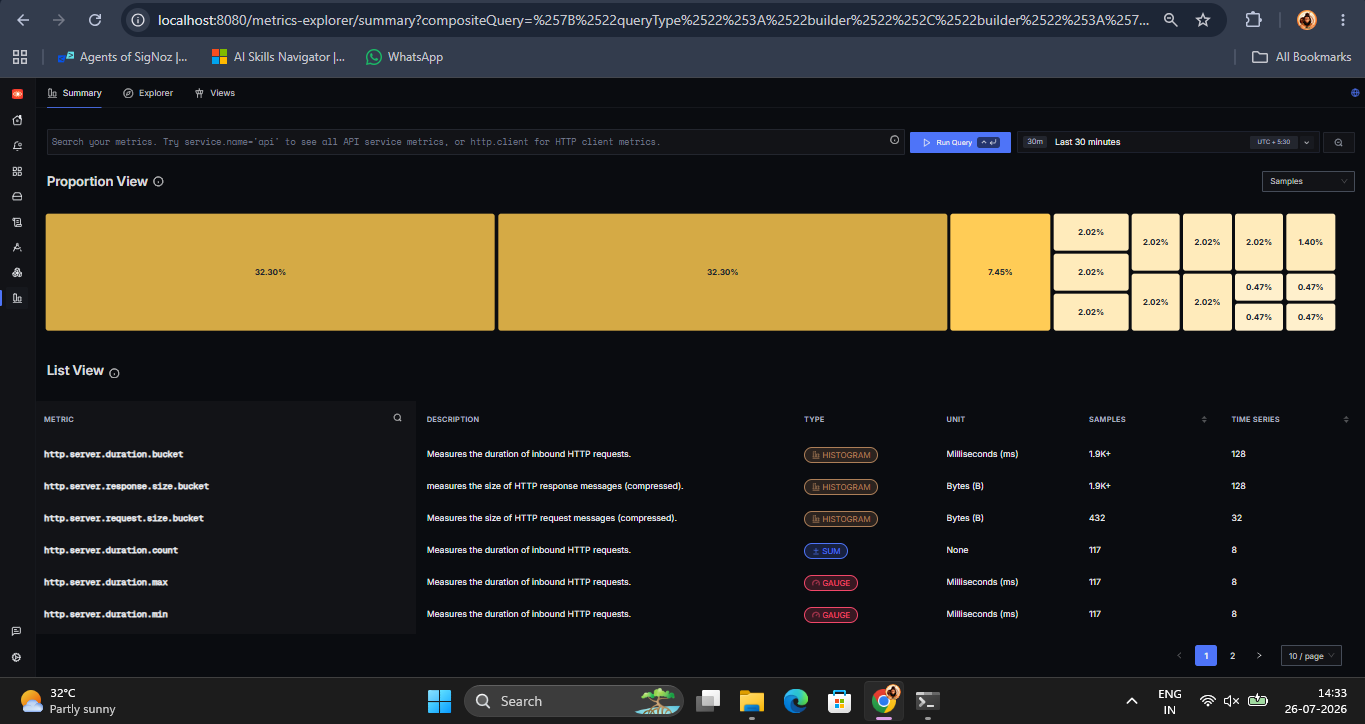
The core idea here is to stop manually hunting for the "needle in the haystack." Instead of you digging through spans to find where a request lagged, the agent analyzes the telemetry data to pinpoint the exact failure point.
How the stack works
The architecture relies on a tight loop between observability data and an LLM:
1. Data Collection: OpenTelemetry (OTel) handles the instrumentation, pushing traces and metrics into SigNoz.
2. Context Extraction: TraceMind pulls the relevant telemetry context from SigNoz when an anomaly is detected.
3. AI Analysis: This context is fed into an LLM agent that understands the system topology and can correlate a spike in latency with a specific database query or a failing downstream service.
Getting it running
If you want to try a similar AI workflow from scratch, the general deployment path looks like this:
1. Deploy SigNoz to collect your OTel data:
git clone https://github.com/SigNoz/signoz.git
cd signoz/deploy
./install.sh
2. Instrument your app with OpenTelemetry SDKs to ensure you have the necessary trace IDs and spans.
3. Connect your LLM via API to query the SigNoz API for specific trace IDs during incident triage.
This approach is a massive step up from standard alerting. Instead of getting a "Latency > 500ms" notification and spending an hour debugging, you get a summary of why it's happening. For anyone managing microservices, this kind of LLM agent integration is the only way to stay sane.
Absolute nightmare. How many hours did you waste before SigNoz actually flagged that trace?