Sentry Tracing: Finding the Silent Retry in my LLM Pipeline

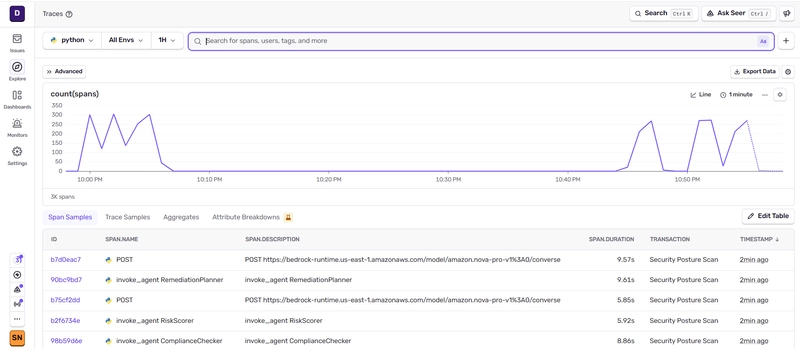
The pipeline follows this flow:
1. ResourceDiscovery: Inventories EC2, S3, Lambda, etc.
2. SecurityScanner: Identifies open ports and public buckets.
3. ComplianceChecker: Maps findings to CIS benchmarks.
4. RiskScorer: Calculates severity and blast radius.
5. RemediationPlanner: Generates the actual fix commands.
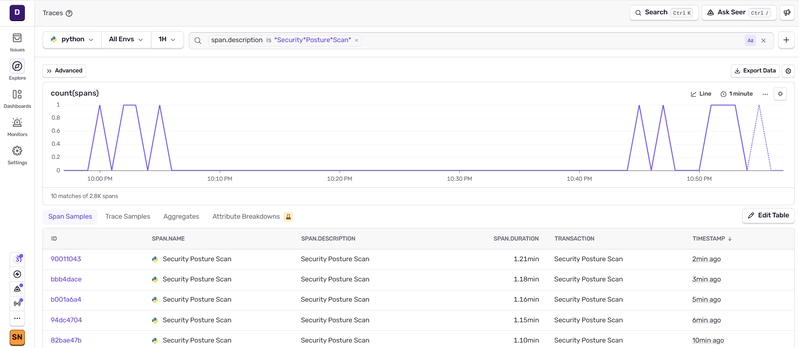
The system runs against live accounts with actual assets (90 IAM roles, 14 S3 buckets, etc.), not sanitized test data. Everything seemed fine until I noticed a massive performance delta. While most agents wrapped up in 5-10 seconds, the SecurityScanner was consistently hitting 22.6 seconds.
Instead of sprinkling time.time() calls everywhere and guessing, I used Sentry’s span hierarchy to look at the gen_ai.invoke_agent traces. The waterfall view revealed something critical: the LLM wasn't just "slow"—it was failing and retrying.
The culprit was my IAMAnalyzer tool. It was fetching every single IAM role in the account, filtering out service-linked roles, and then dumping a 27KB JSON blob directly into the context window. The LLM was getting overwhelmed by the payload size, triggering CrewAI's internal retry logic. I was essentially paying a "token tax" for redundant attempts because the initial tool output was too bloated.
To fix this, I implemented a pagination strategy and a relevance filter. Rather than dumping everything, I now sort roles by their last used date and only pass the most active/relevant ones to the agent.
Here is the technical breakdown of the fix in src/security_posture/tools/iam_analyzer.py.
The Buggy Implementation:
This version fetched up to 100 roles without a strict budget, creating a massive JSON string that choked the LLM.
# Fetches ALL roles without pagination limit
roles = iam.list_roles(MaxItems=100)
role_details = []

for role in roles["Roles"]:
    role_name = role["RoleName"]
    if role.get("Path", "").startswith("/aws-service-role/"):
        continue
    # Analyzes every single role...
    attached = iam.list_attached_role_policies(RoleName=role_name)
    # ...builds massive JSON output
The Optimized Implementation:
I switched to a paginator and added a sorting mechanism to ensure the LLM only sees the roles that actually matter for a security audit.
# FIX: Paginate and sort by relevance
all_roles = []
paginator = iam.get_paginator("list_roles")
for page in paginator.paginate():
    all_roles.extend(page["Roles"])

# Filter service-linked roles (which can't be modified anyway)
auditable_roles = [
    r for r in all_roles
    if not r.get("Path", "").startswith("/aws-service-role/")
]

# Sort by last used date (most active first) to prioritize analysis
auditable_roles.sort(key=_last_used_sort_key, reverse=True)
# Only send the top N most relevant roles to the LLM
top_roles = auditable_roles[:20]
By implementing this token budget guard and pagination, I saw a 42% reduction in output volume and a 21% increase in overall agent speed. The "silent retry" disappeared from the traces, and the SecurityScanner's execution time dropped back down to the 5-8 second range.
This was a huge lesson in AI workflow optimization: when an LLM agent slows down, don't just look at the model—look at the size of the tool outputs you're shoving into the context window.
For those interested in the full deployment, the source is available here:
https://github.com/simplynadaf/aws-security-posture-agent