A/B Testing: Why P-Values Matter for LLM Deployment
When running an A/B test on AI workflows, the p-value is the only thing keeping you from falling for noise. If you're seeing a 2% lift in user satisfaction but your p-value is 0.15, that "gain" is statistically insignificant. You haven't improved the model; you've just encountered a random fluke in your test data.
For those doing a deep dive into deployment decisions, here is the technical checklist I use to determine if a version is actually ready for a full rollout:
- Null Hypothesis (H0): The new prompt/model version has no effect on the target metric compared to the baseline.
- Significance Level ($\alpha$): Usually set at 0.05. If the p-value is below this, we reject the null hypothesis.
- Sample Size: LLM outputs are high-variance. You need a large enough N to ensure the power of the test is sufficient to detect the effect size you care about.
- Confidence Intervals: Instead of looking at a single point estimate, look at the range. If the interval crosses zero, the result is unreliable.
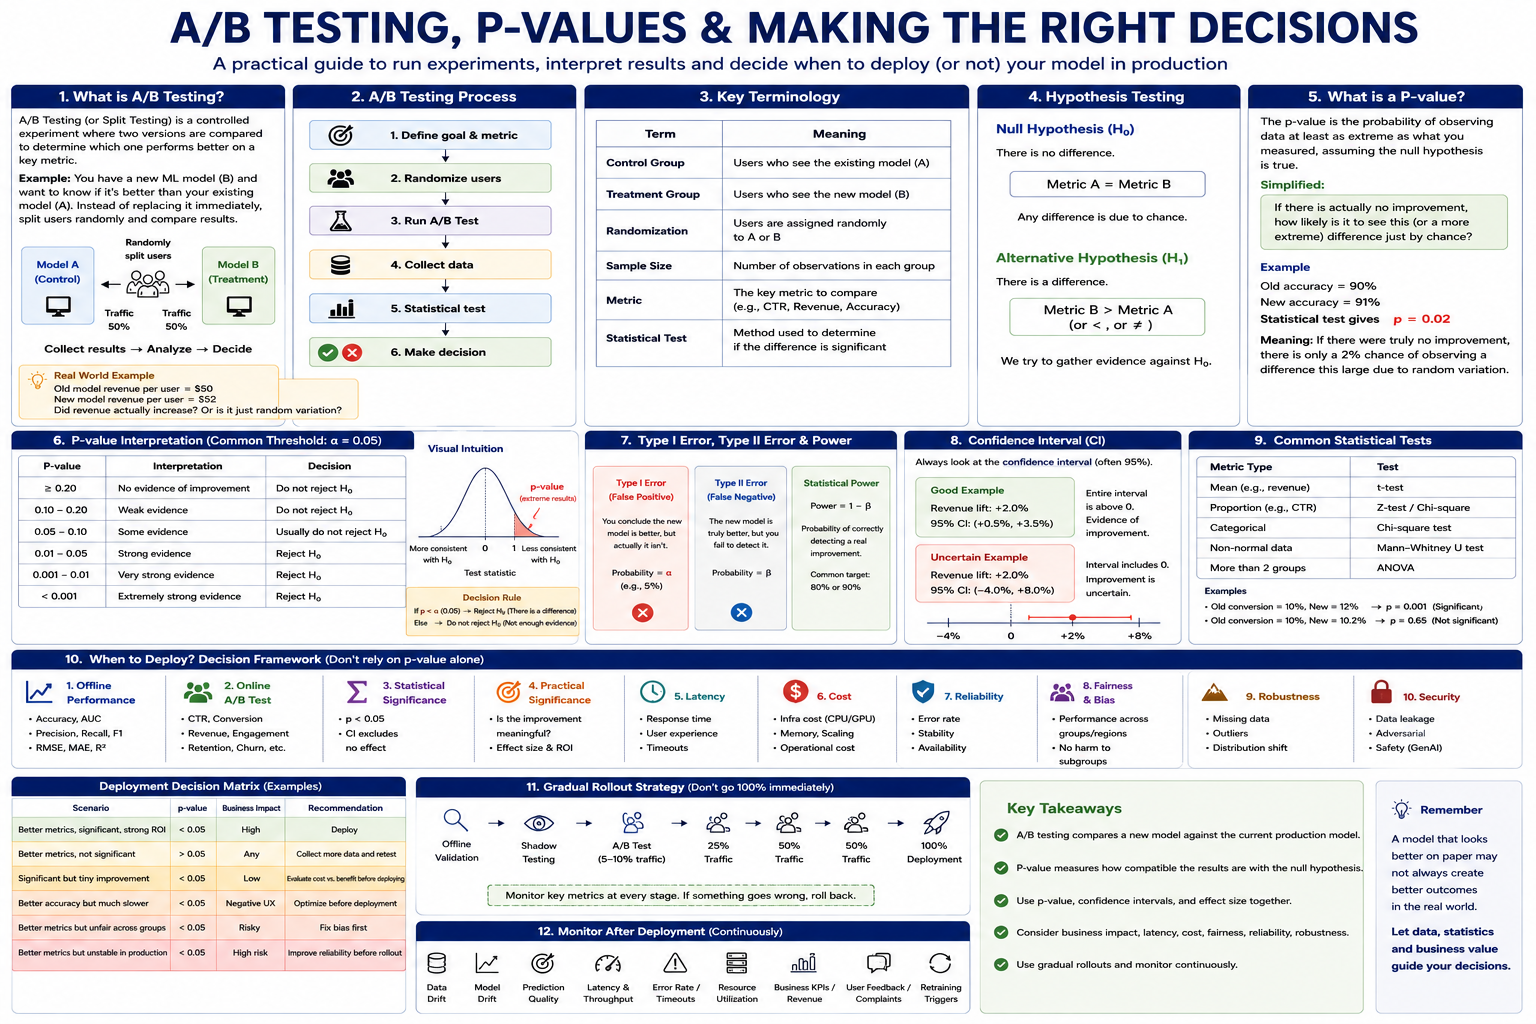
The danger in prompt engineering is the "winner's curse"—where a specific prompt performs amazingly on a test set but fails to generalize. This is why a step-by-step validation process is non-negotiable.
If you're struggling with inconsistent results between your staging environment and production, check your distribution. If the production traffic doesn't match your test set, your p-values are lying to you. Stick to a real-world AI workflow where you canary release to 5% of users and monitor the statistical significance over a fixed window before scaling.