SHAP: A Practical Debugging Workflow for ML Models
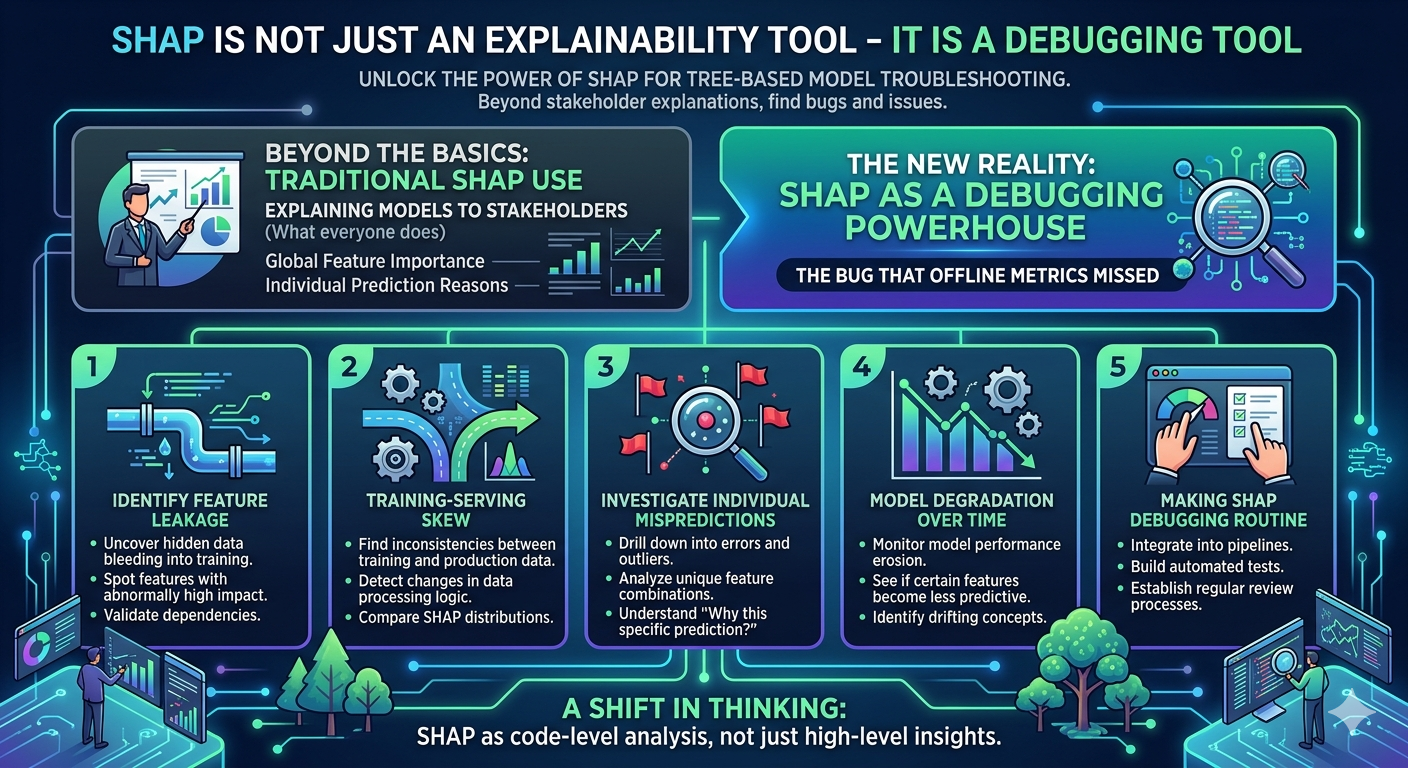
Finding "Data Leakage" Bugs
The most common bug I've encountered in production ML is data leakage—where a feature contains information about the target that wouldn't be available at inference time. A model with 99% accuracy usually isn't "perfect"; it's usually cheating.
If you run a SHAP summary plot and see one feature with a massive impact while others are negligible, you've found your bug. For example, in a churn prediction model, if last_payment_date has a SHAP value that perfectly correlates with the target, it's often because that date was updated after the churn event occurred.
Technical Implementation for Debugging
To use SHAP for debugging, you need to look at the individual force plots or the summary plot to identify "impossible" feature contributions. Here is how I set up a diagnostic check for a XGBoost model:
import shap
import xgboost as xgb
from sklearn.model_selection import train_test_split

# Load data and train a basic model
X, y = load_my_dataset()
X_train, X_test, y_train, y_test = train_test_split(X, y, test_size=0.2)
model = xgb.XGBClassifier().fit(X_train, y_train)

# Create the SHAP Explainer
explainer = shap.TreeExplainer(model)
shap_values = explainer.shap_values(X_test)

# Summary plot to spot anomalous feature importance
# If one feature is an outlier in importance, investigate it for leakage
shap.summary_plot(shap_values, X_test)
Diagnosing Model Drift and Bias
Beyond leakage, SHAP is the only way to diagnose why a model is failing on specific slices of data (e.g., why it's failing for users in a specific region). Instead of guessing which feature is causing the error, I use a dependence plot to see the interaction between two variables.
If you notice a sharp, unnatural jump in the SHAP value at a specific threshold (e.g., at exactly 18 years old in a credit score model), you've likely found a hard-coded bias or a data collection error in the pipeline.
Real-World Debugging Example: The "Zero-Value" Bug
I recently dealt with a regression model that was consistently under-predicting for a specific cluster of users. Standard error analysis showed the residuals were high, but didn't say why.
By plotting the SHAP values for those specific outliers:
- Observation: The feature
account_agehad a strong negative SHAP value. - The Bug: I discovered that missing values in
account_agewere being filled with0by the preprocessing pipeline, and the model was interpreting0as "very new account" rather than "unknown." - The Fix: Changing the imputation strategy from zero-filling to median-filling shifted the SHAP values back to neutral, and the prediction error dropped by 15%.
Comparison: SHAP vs. Feature Importance
If you are still using .feature_importances_ from Scikit-Learn or XGBoost, you are missing the "direction" of the bug.
- Standard Feature Importance: Tells you a feature is "important" (Global).
- SHAP Values: Tells you if the feature is pushing the prediction up or down for a specific row (Local).
- Reliability: Standard importance is biased toward high-cardinality features; SHAP is mathematically grounded in game theory and remains consistent across different model types.
Integrating SHAP into a deep dive of your model's failure cases is far more valuable than using it for a final presentation. It transforms a "black box" into a transparent system where you can actually trace the logic of a wrong prediction.